My Dashboard
Use this function to view user-related data and selected reports.
| There are several types of dashboards throughout the application. For example, under ITSM, each management function has its own dashboard, as does ITAM Configuration Management. Refer to those individual sections for details. |
In the navigation pane, select My Dashboard. The My Dashboard window displays.
User Data
The upper portion of the windows contains user-related data such as CIs, requests, problems, incidents, changes, knowledge items, and known errors.
|
The list at the top of the window cannot be changed or removed as this information displays other data collected throughout the application. However, the details for a line item can be viewed by clicking on the item. |
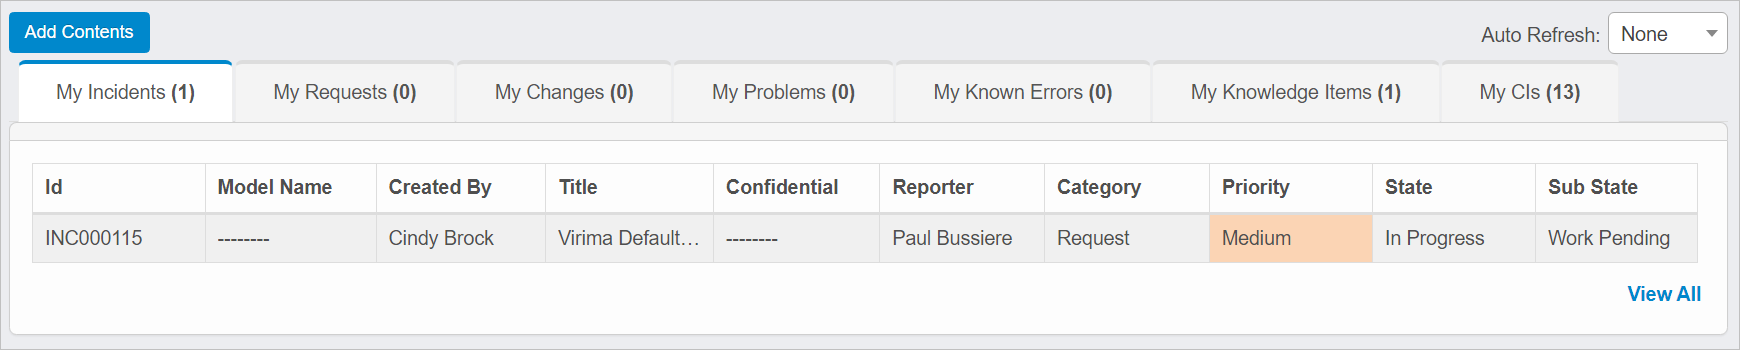
Click Show All to display all items for the selected category (such as CIs, Requests, and so forth).
Reports
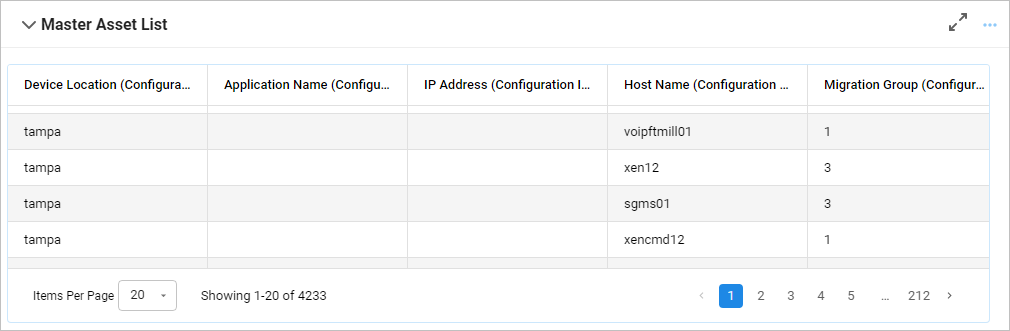
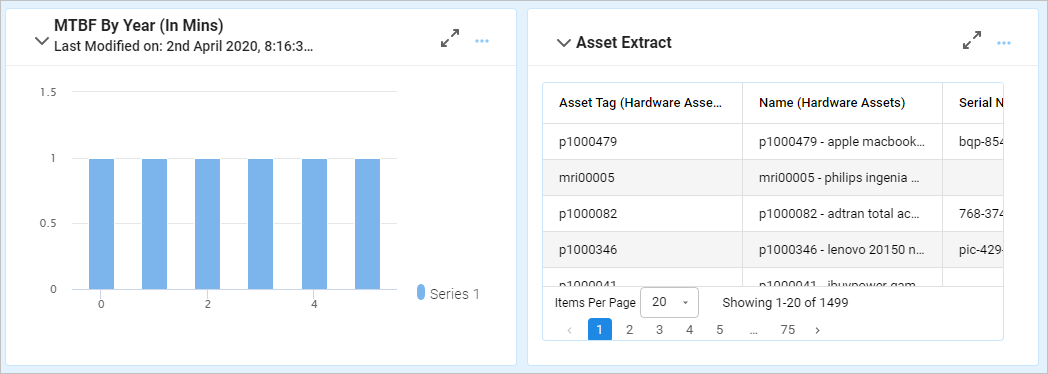
The lower area of the window shows all reports that have been added (examples are shown below).
To manage dashboard contents, click Add Contents.
Other Functions and Page Elements